
Video is the new king of content.
With 93% of marketers using video marketing in their overall marketing strategy, the share of video in the marketing pie has increased manifold over the past few years.
Besides, the focus of social media companies on releasing video content tools has also strengthened this trend.
For marketers who have second thoughts about investing in video marketing, we have covered the latest trends reported by several studies in this article.
These stats will help you know how video marketing influences customers.
Here we go!
Common Video Marketing Statistics
1. According to Statista, the amount spent on video marketing will reach $92.253 billion in 2022.
2. Video marketing is the fastest-growing type of marketing in digital advertising.
3. In 2022, video content will make up for 82% of the internet traffic.
4. Viewers claim they retain 95% of the information given in the form of videos.
5. A study from Hubspot shows that 54% of video consumers are willing to see video content from their favorite brands.
6. More than 78% of viewers consume video content every week, and 55% of them engage every day.
7. OptinMonster found that 72% of consumers prefer to learn about a product or a service through video content.
8. Webinars are the most common types of business-related video.
9. Marketers land 66% more qualified leads through video marketing.
10. WordStream reports that adding a video on the website’s landing page can increase conversion by 18%.
11. Another study noted that adding video on the webpage increased the average time spent.
12. Since 2016, the number of businesses using video content for marketing has increased by 41%.
13. A study by Wyzowl shows that 87% of marketers claim they are happy with the ROI obtained from video marketing.
14. Marketers using video marketing made revenue 49% faster than organizations not using video marketing.
15. If text and video are available for a topic, 95% of executives say they would prefer to make a video on that topic.
16. Videos on social media get 12 times more shared than text and images combined.
17. Currently, 86% of businesses utilize videos as a marketing tool.
Video Consumption Statistics
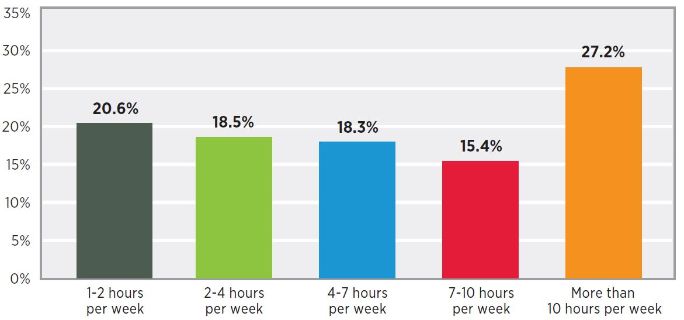
18. According to WorldStream, 33.33% of all online activity is video consumption.
19. Every week, people spend 18 hours watching videos online.
20. As per Think with Google, 60% of viewers prefer watching videos online rather than on television.
21. Wyzowl observed that 98% of the viewers watch videos explaining the product or service.
22. Around 84% of video consumers claim they decided to buy a product or service after watching a brand‘s video.
23. Research conducted by Limelight shows an increase in online video content consumption across all age groups, and the most significant increase was observed among people over 46 years of age.
24. Social Media Week reported that 75% of people prefer watching videos horizontally on their mobile devices.
25. More than one billion hours of videos are viewed on YouTube daily.
26. Globally, more than 75% of videos are consumed via mobile devices.
27. Majority (87%) of videos related to the business are viewed from a desktop.
28. A survey by Verizon & Publicis found that 92% of the participants watched videos with the sound off, and about 50% relied on captions.
29. Videos that had a duration of 90 seconds or less had a retention rate of 50%.
30. 92% of the videos viewed from mobile devices are shared with others.
Social Media Video Statistics
We have divided video marketing statistics for social media into different categories. Let us start from general social media video statistics.
31. Social media videos are viewed 48% more than other platforms.
32. A research by Hubspot shows that 17% of marketers include live videos on social media platforms as a part of their marketing strategy.
33. Among all the social media channels, YouTube is preferred by 88% of marketers for uploading videos.
34. The Global Web Index 2021 suggests that 16% of social media users prefer watching vlogs for researching products.
Social Media Video Statistics for YouTube
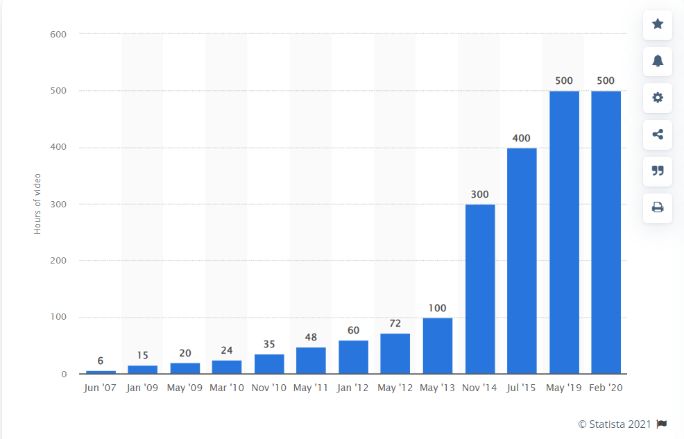
35. More than 500 hours of videos are uploaded on YouTube daily.
36. 70% of YouTube videos are consumed through mobile devices.
37. YouTube is the most preferred channel for consuming videos for about 67% of the viewers.
38. On average, the time spent daily by a viewer on YouTube is about 17 minutes.
39. According to Think with Google, 40% of people have purchased a product that they discovered on YouTube.
40. More than 50% of social media marketers create content for YouTube.
41. YouTube helps about 90% of the viewers to discover new brands or products.
42. People consuming videos on YouTube through their mobile devices pay two times more attention to the content than the television viewers.
43. 62% of search results on Google include videos, of which 80% are from YouTube.
44. YouTube ads viewed on mobiles get 62% more attention than TV ads.
Social Media Video Stats for Facebook
45. More than 8 billion videos are viewed on Facebook daily.
46. On average, Facebook users spend 26 minutes per day watching videos on the platform.
47. Socialinsider noticed that Facebook accounts with over 100K followers have 71% of video content posts.
48. Videos that can be watched vertically on mobile devices showed the most engagement on Facebook.
49. More than 500 million people watch videos on Facebook.
50. Facebook video ads are used by more than 73% of marketers to promote their products or services.
51. The conversion rate is highest for Facebook video ads with a duration of 16 to 20 seconds.
52. Viewers can remember Facebook video ads by companies 23% more if their names appear within the first 3 seconds.
Social Media Video Stats for Instagram
53. The time spent watching Instagram videos has increased 80% since 2017.
54. A study by YetPo revealed that 30% of Instagram users purchased the product after discovering it from the platform.
55. Around 77% of marketers create video content for IGTV.
56. Studies have found that 79% of new customers acquired by brands or businesses were through Instagram.
57. Marketers also claim that Instagram stories have helped them to acquire 73% more customers.
58. About 70% of users swipe up to follow the links mentioned by brands on their Instagram stories.
59. A study also proves that Instagram posts get two times more engagement than the other posts on other social media platforms.
60. Usage of stickers on Instagram stories can boost engagement by 83%.
Social Media Video Trends for Linkedin
61. Video content is the most shared post on Linkedin.
62. Around 80% of Linkedin users prefer watching videos with sound off.
63. According to research by Wyzowl, 38% of marketers create video content for LinkedIn, out of which 75% claim it was a success.
64. Live streams on Linkedin can generate more engagement than published videos.
65. Videos on Linkedin that are between 30 to 90 seconds have shown the best results for businesses.
Video Content Marketing Stats on Ad Spending
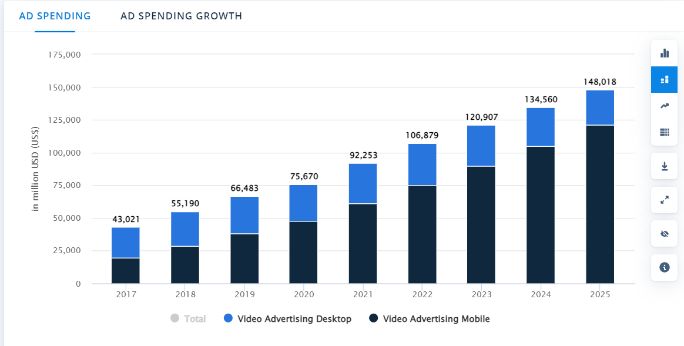
66. Video ad spending is expected to reach $456 billion by 2025.
67. In 2020, digital video ad spending was reported to be $9.95 billion from the United States alone.
68. Wyzowl noted that 78% of marketers observed an immediate increase in sales by using video marketing.
69. Every year, marketers are increasing the budget for video marketing by 25%.
70. In the United States, the video marketing industry is worth $135 billion.
71. Another stat by Wyzowl shows 82% of the digital video marketers generated leads through video content.
72. According to Forbes, call-to-actions are more effective in video content.
Post-Pandemic Video Marketing Trends
73. Video content was one of the industries that saw minimum damage after the pandemic hit.
74. A survey also showed that 61% more Gen-Z and Millennials were watching video content during the pandemic.
75. The research by Wyzowl put forward that 91% of marketers claim video content has become more relevant than ever for brands and businesses in this era of the pandemic.
76. In 2020, about 24% of marketers tried video marketing for the first time.
77. After the pandemic, 70% of marketers plan to increase their video marketing budget.
78. Due to the pandemic, 74% of the marketers were forced to rely on video marketing strategy.
79. The study by Wyzowl shows that because of Covid, plans of 92% of marketers were affected.
80. More marketers are going to utilize video content for marketing in the coming years.
General Statistics for Video Marketing
81. Video content has been said to have the best ROI by 51% of marketers among all the forms of content.
82. As per a study by Vidyard, marketers achieved a 34% higher conversion rate by including video content in their marketing campaigns.
83. Due to explainer videos, 43% of the marketers say that customer support calls have decreased.
84. The organic traffic can be increased by 157% with the help of video content.
85. Video marketing is used by 71% of B2B marketers.
86. Emails that contain video content in them get 96% higher click-through rates than emails with no video content.
87. The email subject line with the word “video” has a 19% more open rate than other subject lines.
88. Emails with video content are preferred by 54% of the subscribers.
89. About 12% of marketers want to incorporate virtual reality (VR) technology in their video marketing strategy.
90. The most common types of videos created by businesses are explainer videos.
91. Adding video content on full-page ads can increase engagement by 22%.
92. Advanced video analytics software is used by 35% of businesses to measure the performance of their video content.
93. Companies using advanced video analytics are more likely to increase the budget for video marketing.
94. Businesses that created more than 50 videos in a year grew by 46% in 2020.
95. Businesses that use video content on webpage increase their chances by 53 times to appear on the first page of Google search.
96. About 43% of the marketers claim they would create more business videos if more resources were available.
97. Explainer videos were watched by 96% of the customers to understand the product better.
98. Video marketing was included in 46% of marketers’ strategy because they believe creating video has become more affordable.
99. Some studies claim that the audience will halt their work to watch a video.
100. 360-degree videos were used by about 14% of the marketers.
101. 360-degree videos were a success, claims 74% of the marketers.
102. Interactive videos are used by just 2% of marketers.
103. More than 90% of the interactive videos are viewed till the end.
104. Entertaining video content can boost the purchase intent by 97%.
105. Demo videos are preferred by about 12% of customers.
Finally..
The above statistics show that video content has helped businesses to increase sales and reach. But it also becomes essential for you to choose the right tools to analyze the performance of your video efforts.
Especially managing and tracking the posts for your video content on social media is one important task. But, what if you get some assistance there?
SocialPilot provides analytics to manage your social media campaigns across multiple platforms. It has several features like performance analytics, schedule management, team and client collaboration, unified performance dashboard and more.
To know what more you can do with SocialPilot, schedule a demo with us today.

