Remember the early 2000s, when email was just another way of communication?
As time passed, emails became an important medium for promoting products and services.
Studies reveal that email marketing has an ROI of 122%.
No wonder it continues to remain one of the most effective ways of marketing and is preferred for its direct reach and ease of operation.
In this article, we will give you 100+ email marketing statistics and facts based on which you can make your own email marketing strategy.
For your ease, we have divided these stats into several categories.
Let’s start.
General Statistics on Email Marketing
1. According to Statista, more than 4 billion people use email, and around 51% of them prefer that brands contact them via emails.
2. A report by Statista states that by the year 2022, more than 333 billion emails will be exchanged daily.
3. OptinMonster says that about 99% of people check their email inbox daily.
4. Two of the world’s most popular email clients are Gmail and Apple iPhone.
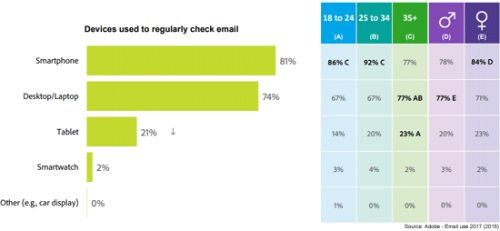
5. A research by Litmus points out that 42% of people use mobile devices to check their mail.
6. Approximately 1.5 billion people use Gmail for emails.
Statistics on Subject Lines and their Open Rates

This section will give you an idea about how and what kind of subject lines drive higher open rates.
7. The subject lines that include emojis have an open rate of 56% more than the subject line with plain text.
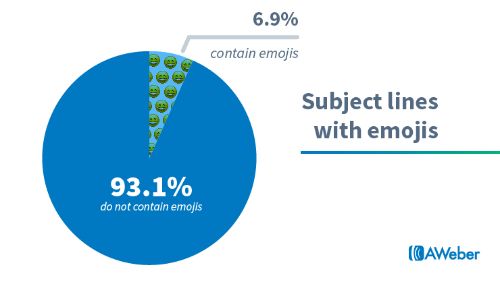
8. Aweber put forward that only 6.9% of email marketers use emojis in the subject line.
9. OptinMonster found that 47% of the email recipients will open your mail depending on the subject line.
10. Simultaneously, 69% of the recipients will mark the email spam based on the subject line.
11. Emails with a subject line that was personalized had an open rate of 26%.
12. Another study by Aweber observed that about 82% of email marketers send emails that include 60 or fewer characters in the subject line.
13. Email recipients using iPhones will see only the first 30 characters of the subject line.
14. Email subject lines related to arts, hobbies, or government were reported to have a higher open rate.
15. The subject line containing words like ‘discount,’ ‘% off,’ ‘free,’ ’help,’ and ‘reminder’ were found to have lower open rates.
16. The subject lines that included the recipients’ names increased the open rate by 18%.
17. Subject lines that created a sense of urgency using words like ‘urgent,’ ‘breaking,’ “important,’ or ‘alert’ had higher open rates.
Stats on Timings of Emails
Ever wondered what is the best time to send an email? Here are some stats that will help you to figure it out.
18. According to GetResponse, the best time to send emails is between 11 am-12 am.
19. The open rate for emails is the least during the weekends.
20. On the other hand, according to Databox, 50% of marketers say there is no best time to send emails; it varies for every person and business.
21. An article by Mailchimp reports the optimal time to send emails depends on the demographic and target industry.
22. A study shows that 35% of marketers send their target audience around 3-4 emails per week.
Stats for Email Click-through Rates
When someone opens your email and clicks on the link given in the text, the process is called a click-through. In this section, we will provide some statistics related to click-through rates.
23. An average click-through rate in North America is 2.41%.
24. In a survey conducted by Hubspot, it was found that about 2 out of 3 people preferred HTML and image-based emails. However, the click-through rate is observed higher for plain text-based emails.
25. The HTML and image-based emails decrease the click-through rate by 23%.
26. Some studies report that adding video to your emails can increase the click-through rate by 300%.
27. The click-through rates can also be escalated up to 73% by including some interactive content in the email.
28. Since the last 12 months, 78% of marketers have claimed that they saw increased email engagement, including click-through rates.
29. Emails that include an option to share on social media can boost the click-through rate up to 158%. (According to a report by Disruptive Advertising.)
30. Emails containing a call-to-action button were reported to have 28% more click-through rates than a simple text link.
31. Email can get six times more click-through rates than Twitter.
Stats About Emails on Mobile Devices
The users of portable and compact devices are more than ever in current times. As said earlier, many people check received emails through mobile devices, which has led to the birth of a new marketing field known as ’Mobile email Marketing’. Let us look at some data related to this.

32. A statistic by Google shows that 75% of Gmail users access their emails via mobile devices.
33. Another study by Campaign Monitor concludes that 33.33% of click-through rates are from mobile devices.
34. About 28% of people from the age group of 19 to 34 open emails on their smartphones first.
35. An email that was first opened on a mobile device and then opened on a laptop or desktop has a click-through rate of 65%.
36. Disruptive Advertising says that 70% of emails that don’t interact well with the recipient’s mobile devices are deleted.
37. Company emails influence around 69% of their prospective customers to purchase products.
38. Some studies also say that 23% of people who open emails on their smartphones will open them again after some time.
39. It was observed that 55% of people from the age group 56 to 67 never open their emails on mobile devices.
40. Adestra in 2019 observed most of the emails in ad campaigns were opened from mobile devices, and only 10% were opened from desktop.
Statistics on Email Automation
The adoption of automation technology in email marketing has made things a lot easier for marketers.
41. Emailmonday in one blog post mentions that 55% of the marketers working in the E-commerce industry use email marketing automation software.
42. The blog post also states that 25% of marketers plan to adopt email automation technology in the near future.
43. The unsubscribe and spam rates for triggered emails were viewed to be around 0.43% and 0.02%, respectively.
44. A research by Ascend2 found emails sent by understanding the customer behavior to personalize emails is the best practice to send automated emails.
45. Results of a survey showed that 30% of the marketing professionals claim that applying automation in email marketing has saved them a lot of time.
Email Stats on Spam Marking
46. Approximately 45% of emails sent every day are considered spam.
47. From about 12.5 billion spam emails sent every year, only one will get a reply.
48. Majority of spam emails (36%) are related to advertising.
49. The number of spam emails can only be decreased by sending emails to subscribers who have opened your mail in the last six months.
50. As of now, the US is #1 among the world’s worst Spam Haven countries for enabling spamming.
Email Marketing Statistics on Segmentation & Personalization
51. SuperOffice published that segmented emails had an open rate of impressive 95% and a click-through rate of 38%.
52. Another study saw an increase of 760% in revenue for companies that sent segmented emails.
53. As per a report by Mailchimp, segmented emails can generate higher click-through rates of 100.95% than non-segmented emails.
54. Around 88% of the users say that they are more likely to respond to an email that feels like it was created for them specifically.
55. Personalized subject lines can get a 26% higher open rate.
56. In a survey, 34% of the respondents said they found the personalization of emails frustrating when it recommended items they were not interested in. For 15% of respondents, miss-spelling their names in the email was also a turn-off.
57. The survey also pointed out that 10% of respondents were not happy when the emails were too personalized or not personalized at all.
58. A study conducted by Experian tells that personalized emails can produce six times more revenue than non-personalized ones.
59. Another study by ClickZ points out that personalization can generate three times more revenue than broadcasting emails if done correctly.
60. A PowerPoint presentation by Ascend2 ranks segmentations as the most effective technique, followed by personalization, and triggers emails.
Email Marketing B2B Statistics
61. Emails in B2B marketing have a 23% more click-to-open ratio than B2C marketing emails.
62. In 2020, the Content Marketing Institute reported that 81% of the B2B companies utilize email newsletters as a part of their content marketing strategy.
63. About 40% of the B2B marketers say that email newsletters are essential for the success of their content marketing plan.
64. A report suggests that 90% of the B2B companies use email engagement as a metric to measure content performance.
65. It was noted that 85% of B2B marketers use some kind of email marketing software.
66. About 59% of B2B marketers agree that email is their top channel for revenue generation.
67. SuperOffice cities, on average B2B companies, send one email marketing campaign to their prospective clients every 25 days.
68. It is also observed that 89% of the B2B marketing campaigns are sent using the company name.
Email Statistics by Industry
Let’s have a look at which industries are making most of the email marketing.
69. Campaign Monitor reported that non-profit industries had the highest open rate of all.
70. Industries with the lowest click-to-open rates were food and beverage, consumer packaged goods, and retail.
71. Average open rate is reported to be around 18% across the industries.
72. Similarly, the average click-through rate is 2.6%.
Statistics on Email Engagement

73. The data captured by Monetate shows that 4.24% of the traffic generated from email marketing is most likely to make a purchase compared to traffic generated from search engines and social media.
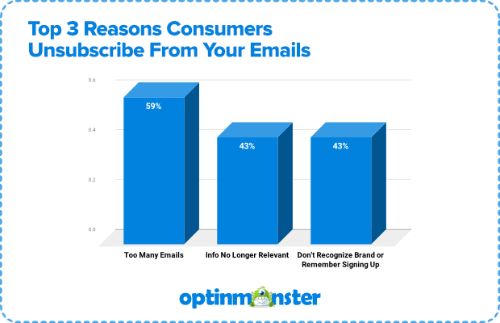
74. One of the reasons people don’t show engagement with the email is because the information is not relevant to them. Another reason for not responding to emails is low brand awareness that makes it difficult to recognize brands.
75. Studies have found that 21% of the recipients engage with emails within the first hour of delivery.
Statistics on Return of Investment (ROI)
76. As per a report by Litmus, for every one dollar spent on email marketing, the average ROI is 42 dollars.
77. A single email is worth approximately $50.
78. A study by DMA found that 60% of email marketers measure conversion rate to determine the campaign’s effectiveness.
79. The ROI gained from email marketing is considered ‘good’ or ‘excellent’ by 73% of the marketers.
80. DMA also found that ROI for email marketing was about 28.5%.
81. Automated emails can drive 320% more revenue than non-automated ones.
82. Transactional email can boost the revenue by six times.
83. WordStream put forward that a series of welcome emails can generate more revenue than just one welcome email.
84. When marketed via emails, shoppers spend 138% more on products than shoppers who didn’t receive emails.
More Email Marketing Statistics 2022

85. Most of the brands spend about a couple of weeks to draft one marketing email.
86. About 8% of cart recovery emails are responsible for conversion.
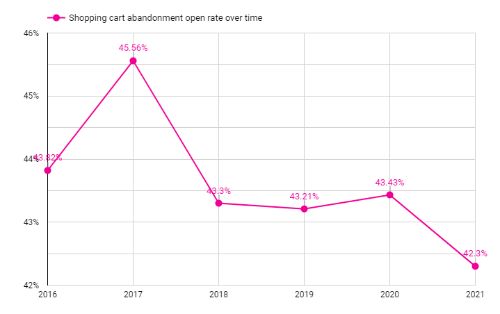
87. Open rate is high for cart abandonment emails.
88. Fashion industry witnesses the highest profit from cart abandonment emails.
89. The average conversion rate for cart abandonment emails is little more than 1%.
90. According to McKinsey & Company, email marketing is 40 times more effective than social media platforms when acquiring customers.
91. Statista reported that 50% of Small and medium-sized enterprises use marketing automation software for sending emails.
92. ROI of email marketing can be increased upto 37% with A/B testing.
93. With the rising popularity of email marketing, 87% of marketers say they plan to allocate more budget for it.
94. High-paid bloggers are shifting their focus on email marketing technology.
95. Brands that included live content in their emails noticed higher ROI in the ratio of 56:1.
96. Email marketing technology is utilized by 82% of B2B and B2C companies.
97. The email with an invitation to webinars had an open rate of 26.04%.
98. The email with a link to YouTube had an open rate of 24.68%.
99. Due to deliverability issues, 16% of emails don’t make it to the recipients’ inbox.
100. A study also shows that 50% of Americans check their inbox in bed and 42% in the bathroom.
101. Some studies have also shown that women are likely to pay more attention to marketing-oriented emails than males.
102. More than 85% of the customers say they would prefer promotional emails monthly, and 15% say they would like to receive them daily.
103. On average, marketing emails contain 434.8 words.
104. Split testing of an email campaign is done by less than 50% of the marketers.
Final Notes
Email marketing is a powerful way to drive sales significantly. Developing a sound and foolproof email marketing strategy is essential for every business, even in the wake of the skyrocketing growth of social media marketing.
Use the key stats listed above for a killer strategy for your business.
Working on email marketing to attract customers is just one part of the job. You need to use a combination of emails and social media campaigns to create a wholesome marketing strategy that reaches every segment of your target audience and maximizes conversions.
Encourage your followers to subscribe to the weekly email blast or promote your social media channels via emails. When both of these marketing strategies are combined, it provides a holistic customer experience and creates a favorable brand image.
However, social media marketing is a high-stakes job, and you wouldn’t want to miss out on any task, lest you risk derailing your campaigns.
Using tools to optimize your marketing campaign can be very helpful. SocialPilot is one such tool to assist you at every stage of your social media marketing journey.
To know more about how we can help you, schedule a demo with us today.


