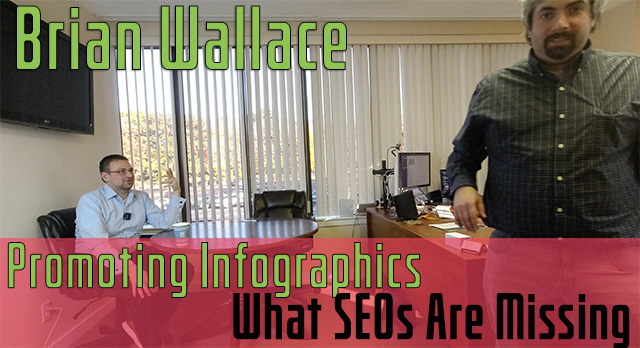
In part one we spoke about how Brian Wallace of NowSourcing got into infographics, how it is not just about links but much more and some cool scores he had with them. In part two, we talk about measuring the success of infographics and other uses for infographics. In part three we talked about what are good and bad infographics and the process of making them. Now the final part, part four, we talk about how to promote these infographics.
Promoting Infographics
Brian said that they spend weeks and weeks on promoting the infographics. Brian explained a lot of people have an incomplete understanding how far a piece of content can go. There is a wide spectrum of outlets and organizations, both large companies and very niche organizations that can use the piece.
So the initial marketing is a couple of weeks but then you can likely repurpose that infographics, or pieces of that infographic in the future. This is the argument of timeliness versus evergreen content, and the evergreen content works forever and may spike in the future without you knowing. It depends on the client goals and the scope of the project.
Visual story telling is another name for infographics but it also applies to speeches, videos, VR, AR, etc. He said when it comes to infographics, PDFs seem to work way better than using AR or VR. We spoke a bit about this and also spoke about the conflict between data journalists and infographic artists. Making infographics interactive is something that makes him cringe because it can be anything.
What SEOs are Missing with Infographics:
Brian said some SEOs simply do not value design and when SEOs make their own infographics they cut short with the design. Brian said stick with your lane, do your SEO and hire someone who really knows infographics to do it.
Video Infographics:
Infographics in videos are often unnecessary he said, they can be amazing and cost a lot of money but are they worth it? He said it is about where to start, so make sure to start with PDFs and go from there. I discussed the YouTube channel The Infographic Show which I love because it is super educational and visual. Brian said it is super negative because it talks a lot about death, which is true – maybe that is why it like it. He also said not everyone is into videos and a lot of people like to scroll, which is probably why I personally stopped watching it.
We also briefly spoke about accessibility with infographics, he said they use alt text but they also will write out the blueprint in text on the page where the infographic is placed.
You can learn more about Brian Wallace @nowsourcing on social.
You can subscribe to our YouTube channel by clicking here so you don’t miss the next vlog where I interviews. I do have a nice lineup of interviews scheduled with SEOs and SEMS, many of which you don’t want to miss – and I promise to continue to make these vlogs better over time. If you want to be interviewed, please fill out this form with your details.
Forum discussion at YouTube.


