
When running experiments, selecting the appropriate metric is probably one of the most important predictors of how successful your experiment will be. Metrics are the compass guiding teams for insights that can be used to make better business decisions. The precision of this guidance depends on the relevance and accuracy of the chosen metrics.
Have you ever watched your investment account grow thanks to compound interest? Well, you know the power of small gains stacking up over time. The same concept applies to ratio metrics in data analysis. They’re like compound returns for your experiments, revealing critical insights that simple metrics miss and leading to more profitable business decisions.
While basic metrics might tell you what happened, ratio metrics help you understand why it happened and what to do next, turning data points into strategic advantages that snowball into business-changing outcomes.
Image source: Optimizely
Why should you use ratio metrics for A/B testing and experimentation?
Ratio metrics are powerful in two different situations:
1. When connection and order of events are important
Ratio metrics are particularly powerful in scenarios where the sequence and connection between two events are important. For instance, consider a scenario where you want to assess the effectiveness of a promotional banner in driving form submissions.
A ratio metric can measure the percentage of users who submitted a form (numerator event) after clicking on a promotional banner (denominator event). This insight goes way beyond what a simple metric (like form submission) could provide, as it accounts for the conditional relationship between these two events.
2. When you want to customize your simple metric with a different denominator
For example, you might want to assign your revenue not to a user or a purchase transaction but to an add-to-cart click.
Additionally, ratio metrics help you:
- See the bigger picture: Is your test impacting revenue, engagement, and retention all at once? Now you’ll know.
- Eliminate blind spots: A single metric could be misleading, but ratio metrics provide more context.
- Optimize for long-term success: Those short-term wins are nice, but how do they stack up over time? Ratio metrics tell you.
How do ratio metrics differ from simple metrics?
Have you ever made a decision based on a single metric only to discover you missed the bigger picture? When you rely on simple metrics like click rates or page views, you only see individual pieces of the puzzle, not how they fit together.
For example, your checkout button clicks might increase by 20%, but if your actual purchases remain flat, what does that tell you?
Something’s happening between the click and the purchase that a simple metric can’t reveal.
Ratio metrics provide real business insights by connecting related events into a single, more insightful measurement. Instead of looking at isolated events, ratio metrics show relationships between actions.
Let’s see how this works in practice with an e-commerce retailer example. When testing a new product page layout, a website can be moved beyond the basic “add-to-cart rate” to measure “revenue per product view.” This ratio metric often shows that while fewer people may add items to their cart, those who did select higher-priced products, resulting in more revenue despite lower conversion.
But there’s caution to keep in mind for ratio metric analysis…
You should be very careful when using ratio metrics and analyzing the results. A ratio calculated from a ratio metric doesn’t give a full context of changes and user behavior in the underlying events. For instance, an improvement in a ratio metric could result from a decrease in the denominator, while the numerator values have not changed.
Therefore, it’s essential to analyze your ratio metrics in the context of other supporting simple metrics to ensure you fully understand the metric values.
The full native analytics dashboard that also uses ratio metrics gives you a broader picture.
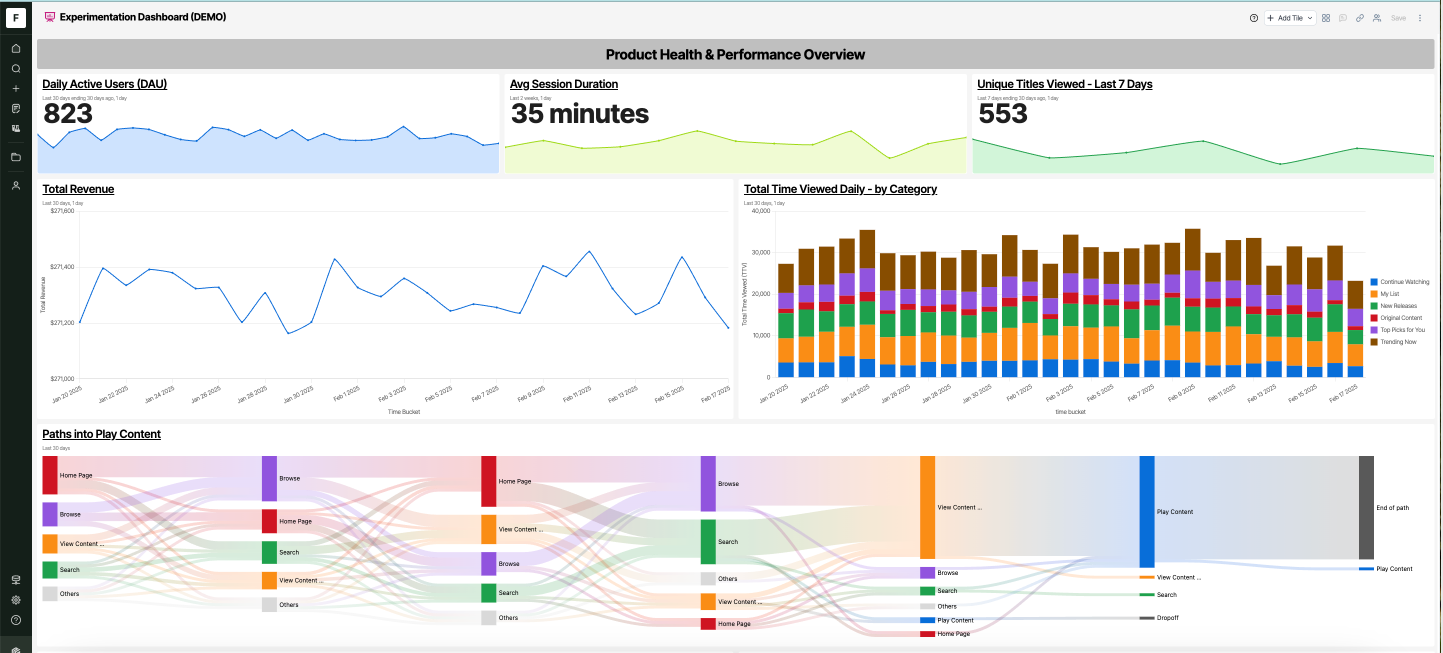
Image source: Optimizely
How ratio metrics work at Optimizely
Unlike simple metrics that use total visitors as the default denominator, ratio metrics allow you to define both the numerator (what you’re counting) and denominator (what you’re dividing by). Optimizely calculates the numerator events specifically for users who completed the denominator event within your specified timeframe.
This customization helps you create a metric that directly answers your business questions, mixing key ingredients like that perfect smoothie.
A banana on its own? Ok fine… but once you blend it with protein powder, almond butter, and almond milk? Now you’ve got the perfect powerhouse breakfast!
That’s what ratio metrics (aka compound metrics) do for your experiments. They combine key insights into something far more valuable than isolated data points.
3 practical applications of ratio metrics in experimentation
Still not sure how ratio metrics can help you? Let’s explore some practical scenarios:
- Testing a new subscription pricing strategy: Tracking conversion rate is good, but does that tell the full story? No. A ratio metric like Revenue per User (Revenue / Unique Visitors) shows you if that price change actually makes you more money or if it just increases sign-ups.
- Tweaking the checkout flow: If time on site increases, it sounds good, right? But what if checkout rates drop? A ratio metric could be Conversions per 1000 Sessions (Total Conversions / Total Sessions * 1000) to help you see whether that extra time on-site is helping or hurting your business.
- Building a new feature: Your Product team built a fancy new feature, but are people coming back to use it? Tracking Feature Retention Rate (Users Who Use Feature 3+ Times / Total Feature Users) helps you distinguish between die-hard fans and one-and-done users.
Picture you’re an e-commerce business testing a new checkout experience. Instead of tracking just conversion rate like most users do, you measure Revenue per Returning Customer (Revenue / Returning Customers). This ratio metric is crucial because it helps you understand the quality of your customer relationships beyond simple transactions.
The results revealed that returning customers in the test group spent 12% more per order, while the standard conversion rate only showed a modest 2% improvement. Without this ratio metric, you might have undervalued the checkout redesign, missing the fact that it was significantly improving the customer lifetime value from your most profitable segment.
A simple conversion metric would have hidden this business-critical insight, potentially leading you to underinvest in an experience that dramatically increases revenue from your most loyal customers.
Wrapping up…
Just like ratio interest grows wealth over time, ratio metrics help you build a more complete, long-term understanding of your experiments. Instead of relying on isolated data points, you’re stacking insights and combining the right ingredients for the perfect measurement strategy.
Remember three key principles when working with ratio metrics:
- Pick metrics that focus on your business objectives
- Always examine the component metrics for complete context
- Use the statistical power of platforms like Optimizely to ensure reliable results
The most successful experimentation programs leverage both simple and ratio metrics strategically, creating a measurement approach that reveals not just what happened, but why it matters to your business.