If you’re using social media for sales enablement and to promote your business, you have several metrics you need to track whether you’re a large, medium, or small business.
Otherwise, you aren’t getting the best out of your social media presence. You might not even be getting your money’s worth.
These days, social media is complicated, and you might not know which metrics you should track and which ones to ignore.
Here’s a list of the most important social media metrics to watch.
What are Social Media Metrics?
In short, social media metrics means using data to determine the impact of your social media marketing efforts on your revenue stream.
Without them, you won’t have any idea if your work is driving business or not.
Why are Social Media Metrics Important?
Social media’s growing influence over the daily lives of billions of people means you can reach your target market effectively on various platforms. Still, you must know what to do to have the maximum impact on them.
If you don’t gauge and track your marketing metrics, you can’t figure out if you’re reaching the right audience.
Metrics clearly define what your audience wants, which helps you refine your products, services, customer support, and more, to maximize your customers’ experience and enhance your revenue and bottom line.
How can you track Social Media Metrics?
Before we get on to our list of the most crucial social media metrics, take a moment to know the different platforms where you can access them.
There are several ways to measure your social media endeavors. The simplest one is to dive into the native analytics section of every platform.
While you can see the analytics section of Facebook, Twitter, and Linkedin by default on their native platforms, to get the analytics of Instagram, Pinterest, and TikTok, you will need a business account – which hopefully you’d already have.
It’s worthwhile to track your most crucial metrics through the native platforms when you are on a low budget and have only an individual social account to handle.
However, things can become pretty hectic for a social media manager handling multiple clients’ accounts across various platforms.
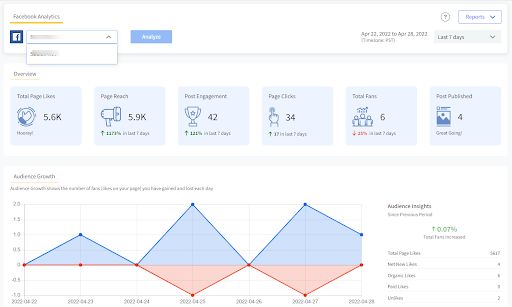
In such cases, the easiest method involves using a social media analytics tool like SocialPilot, which enables you to see the metrics of every major social media platform.
With SocialPilot, you can easily filter multiple social accounts from a single page and get updates on posts, engagement, reach, and audience insights.
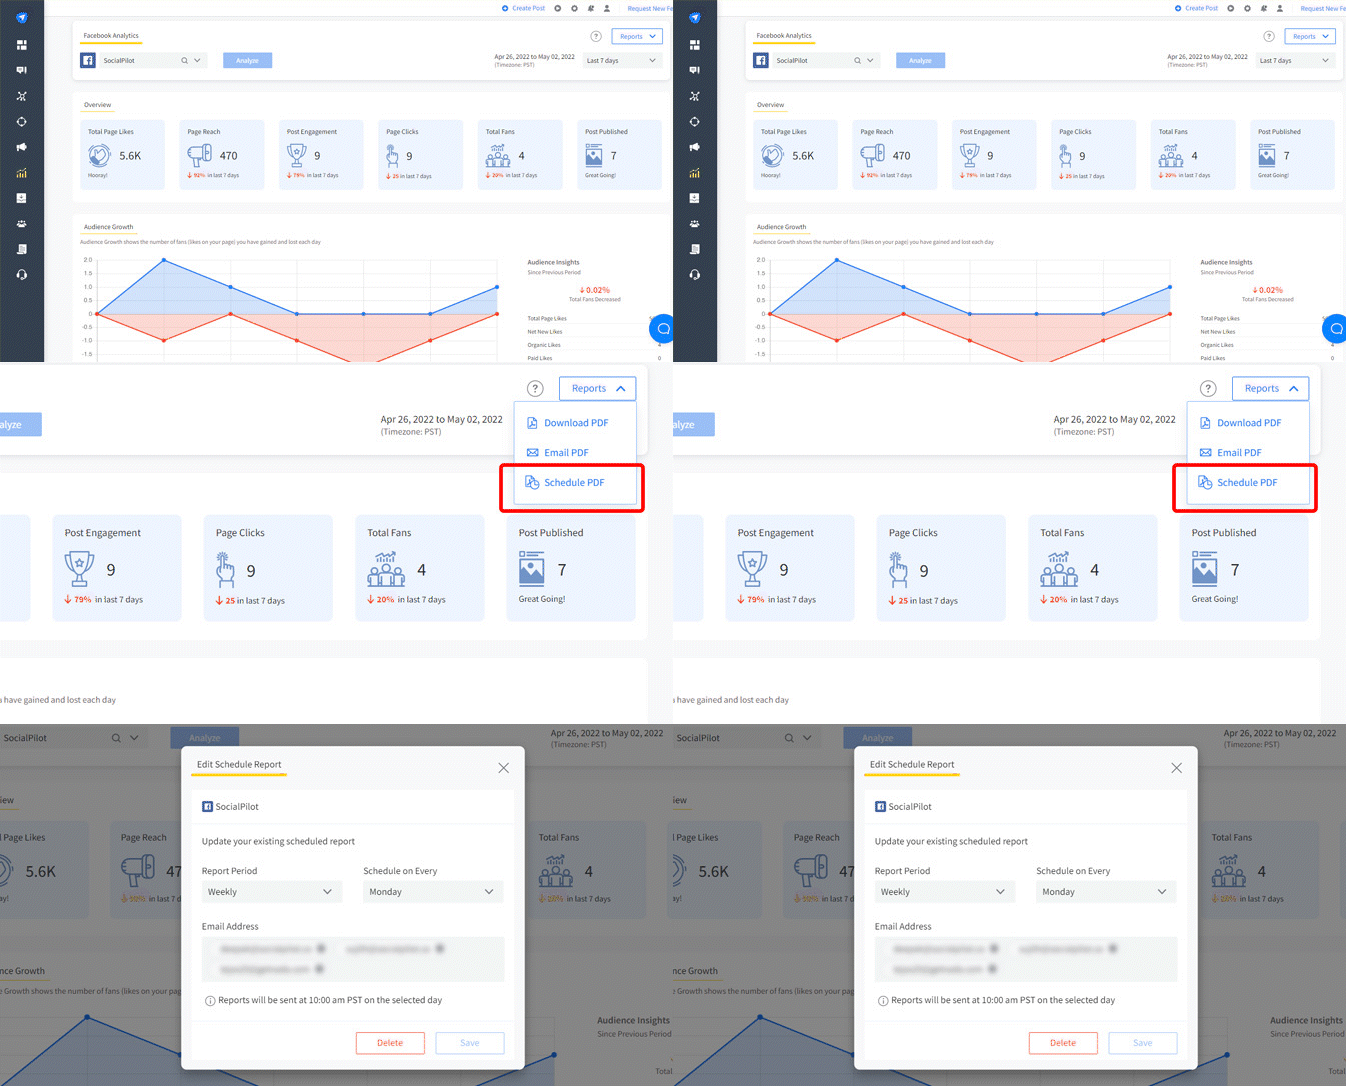
Do you dread sending monthly social performance reports manually to different clients? Sending reports manually is a thing of the past anyway.
Use SocialPilot to download or schedule your report in advance to share it automatically later with clients and teammates effortlessly. The report-sharing feature saves you a great deal of time by automatically pulling and sharing key metrics. It ends your repetitive turmoil of remembering and sending the performance report to clients and stakeholders.
Now that you know where to start tracking your social media analytics data, it is time to figure out what you need to track.
Sometimes with so much information in your hand, it’s hard to decide which metric you should track consistently.
Hence, we have compiled a list of must-track metrics to ease your efforts.
12 Social Media Metrics to Track
1. Average Engagement Rate (AER)
The average engagement rate on any social media platform is the interaction level between your posts and your audience.
This is one of the primary methods for determining how well your social media marketing efforts are working for you, but it’s not as simple as counting the number of interactions on your posts.
To calculate your average engagement rate, you’ll add your total interactions on either a specified number of posts or all your posts over a given period, divide by your number of followers, and then multiply by 100.
If you want to calculate your engagement rate on a specific post, add up all your interactions (reactions, comments, etc.), divide by the total number of impressions on your post, and then multiply by 100.
2. Applause Rate
What’s an applause rate?
If you’ve never heard of this metric before, you aren’t alone. Your applause rate is the number of likes, favorites, or other approval actions on each of your posts.
Think about why you click “like” on someone’s Facebook post.
Regardless of whether it made you laugh, you think it imparts a good idea, or some other reason, you decide to let the poster know that it has value to you.
In this same way, you can determine how much value your posts have to your audience. The more approval actions you get on your posts, the more value you’re providing to your audience.
To calculate your applause rate, add up the number of approval actions on all your posts for a specific date or over a given period divided by your total number of followers, and multiply by 100.
3. Conversion Rate
Conversion rates are one of the most prominent metrics most companies track because it tells you how much revenue your social media marketing is bringing in.
Your conversion rate is the number of people who take some kind of action on your page divided by your page’s total visitors.
Those actions can include things like:
- Clicking on your website link or another link of yours
- Subscribing to your newsletter
- Registering for an event
- Downloading something like an eBook, white paper, or other gated assets and visual presentations
Your conversion rate is so important that social media platforms themselves, along with analytics software, tend to put them front and center in your metrics.
They do that because your conversion rate is the starkest illustration of how valuable your audience thinks you are. If you’re getting lots of visitors but few conversions, you know it’s time to change your strategy.
4. Brand Awareness
How much attention does your brand get? Are you a household name? Or only a small niche of people know who you are?
Brand awareness is just the number of people who are aware about your brand and is correlated to word-of-mouth marketing.
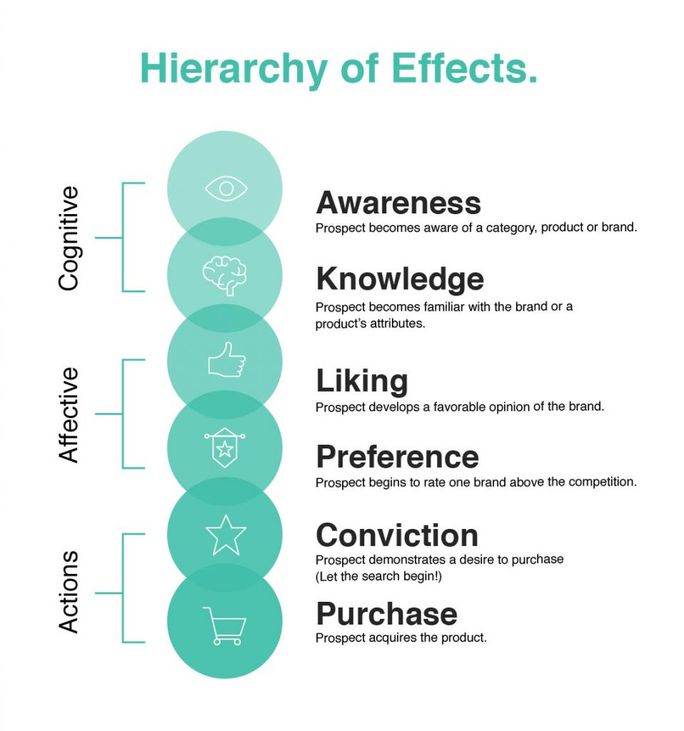
Tracking brand awareness is something else entirely, though.
Your true level of brand awareness is how many people are and become aware of your brand over a given reporting period, like a quarter.
To determine this, look at your mentions, impressions, shares, and clicked links across your social media platforms. Add them together and see how much attention you’re getting over the time you’ve chosen.
Still confused? Brand monitoring tools can help you track your brand awareness and interpret the data for you.
5. Cost-Per-Click (CPC)
Cost-per-click, or CPC, deals with the advertising for which you’re paying. For instance, if you’re running paid advertisements on Facebook, your cost-per-click is how much you pay Facebook for each click on your ad.
Most businesses devote a large part of their operating budget to advertising and marketing. Since you’re likely to advertise across several platforms, you might find yourself tempted to look at your total spending.
In that case, you have a more difficult time determining whether your advertising efforts on each platform are worth the money you’re spending on each platform. Your CPC is a far better metric for that than your total amount spent.
You merely need to check each platform’s ad manager to see your CPC. Be sure to check it often.
6. Click-Through-Rate (CTR)
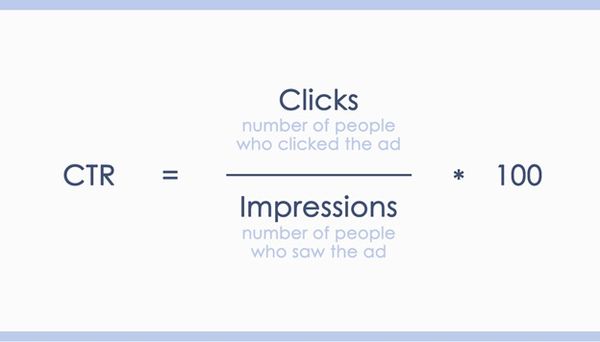
Click-through rates, or CTRs, deal with how many people click on the call-to-action links you put in your ads and posts.
Because it’s tied directly to how many people click on those links, other metrics, like your applause rate, your CPC, and even your average engagement rate, don’t figure into your CTR.
People click on links because they want to know more about you and what you offer.
If your posts aren’t sufficiently compelling, people won’t click on your calls-to-action. At that point, you’re pretty much just wasting time and money.
Calculating your CTR involves tallying a post’s total link clicks and impressions and then dividing your clicks by your social media impressions.
Multiply that by 100, and you get your CTR.
You want to tally both for the same reporting period and across your target audience. Many tracking tools and dashboards will break your total audience down into segments for you, so once you know your CTR, you can see how much of it comes from your target audience.
7. Virality Rate
Not everyone wants to become a viral sensation, and indeed, very few people and organizations do. It’s possible to go viral with videos and other types of content. Videos generally tend to do the best since people love short-form and visually stimulating content.
However, your virality rate can still give you valuable information about how well your social media campaigns fare.
Your virality rate is the number of unique views vs. the number of people who share your post. Something that gets a ton of likes but few shares is more valuable to people than a post with fewer likes but a much higher number of shares.
8. Cost-Per-Mile
Does that look a little strange?
Cost-per-mile means cost per thousand impressions on your posts. Every time someone scrolls past your post, it registers as an impression. You’ll notice that your impressions are much higher than your applause and engagement rates.
You can test your posts and ads with an A/B test, in which you split your audience into two groups and show each one a different variation of a post or ad.
This only works for two variations on a single post, so if you want to test multiple variations on images, headlines, etc., you’ll need to run multiple tests.
Because it only looks at impressions, an A/B test is a far less expensive way to test different things on your audience and see what resonates the most with them. You should check your CPM regularly on your platform’s ad manager and perform A/B tests regularly as well.
9. Bounce Rate
Bounce rates are possibly one of the most difficult metrics to understand and improve upon.
On your website, your bounce rate is the number of people who land on a page on your site and then quickly navigate away.
On social media, your bounce rate is the number of people who click on a link in your post and then quickly move away from the page on which they landed. You can measure your social media traffic this way and see what kind of return-on-investment you’re getting.
If you have a low bounce rate, especially compared to similar organizations and pages, then you’re targeting the right audience the right way. The easiest way to learn and track your bounce rate is with Google Analytics.
10. Average Engagement Rate (Likes and Shares)
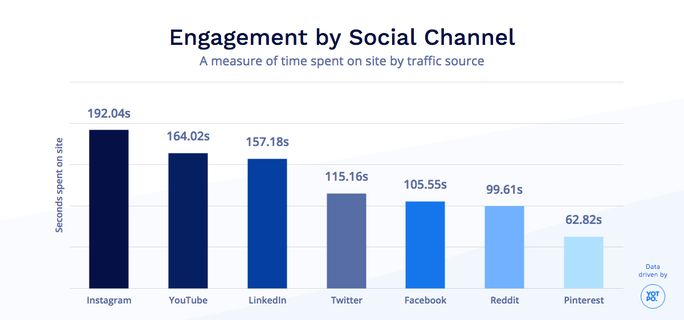
We discussed your average engagement rate above, but what is a good engagement rate? It turns out that what’s good on one platform can be either excellent, terrible, or about the same on another.
These are average and good AERs by platform:
Facebook:
Twitter:
- Average: .5-1%
- Good: 1.5-2%
Instagram:
- Average: 1-2%
- Good: Above 3%
LinkedIn:
- Average: 1-2%
- Good: Above 2%
The wildly different numbers are due to user behavior and also each platform’s design. Twitter, being a microblogging platform, gives users the ability to read entire posts at a glance while continuing to scroll.
If they stop to interact with your post, it’s a big thing, but it translates to a negligible engagement rate.
On the other hand, Instagram is a visual platform where people spend time looking at individual posts. They’re more likely to interact with your posts there. The same is true of Facebook.
Algorithms on all the platforms track what users do with your posts and use that information to show them more or fewer posts from you. The better your AER, the more the algorithms will elevate your posts.
11. Social Share of Voice (SOV)
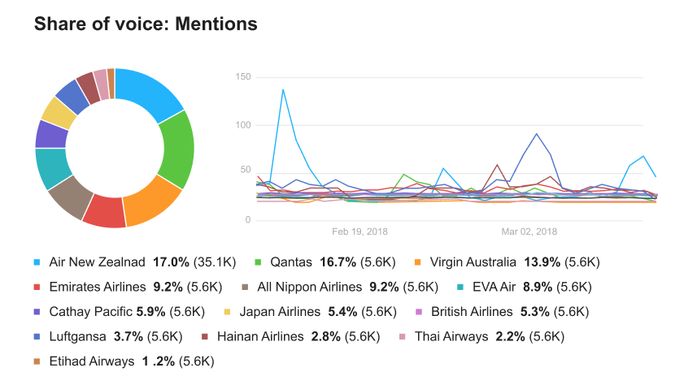
You want to outshine your competitors, right? Social share of voice is how you know whether you’re succeeding.
This metric looks at your direct and indirect mentions vs. those of your competitors.
If you consistently have more, then your social media efforts are more successful than your competitors. Calculating your social share of voice isn’t difficult. Track your mentions and those of your competitors over a specific period.
Add the two together, and then divide yours by that total. Multiply by 100, and that’s your social share of voice.
12. Follower Count and Growth
Knowing how many people are following you is good because you can’t grow your audience if you don’t know where you’re starting from at the beginning of a given reporting period.
The more important metric here is your follower, or audience, growth rate.
How quickly are you gaining new followers each month, quarter, or year, and how does it compare to the previous reporting period?
Also, how does it compare to your competition? Your follower count growth depends on the impact you have. The greater your impact, the more quickly you’ll gain new followers. You calculate it like this:
- Determine your net new followers (total new followers minus followers lost)
- Divide that by your total audience and multiply by 100
What you don’t want to see is a negative growth rate, because that means you’re losing followers faster than you’re gaining them.
Wrapping Up
Whenever you post to social media on behalf of your business, you should be using all of the above metrics. Now that you’re familiar with CTR, AER, CR, and CPC, you can start to analyze what numbers are good for your brand.
By tracking these vital social media metrics over time, you’ll identify your own brand’s baseline stats, before the dynamic trends emerge. The next step is to use them to understand what changes to make to better engage with your users.
At the end of the day, if you track these metrics and change your social media strategy accordingly, you’ll get a much better return on your investment and grow your business.
And don’t forget to use a social media analytics tool like SocialPilot that helps you with your marketing efforts.


